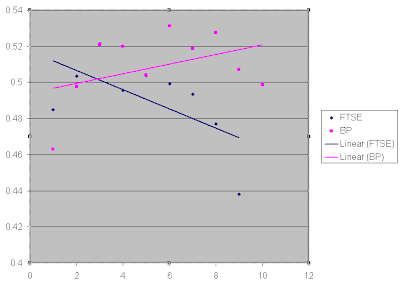
Data for FTSE
Length | Count | % | root | cum_root |
1 | 1631 | 0.484839 | 0.484839 | 0.484839 |
2 | 853 | 0.253567 | 0.503555 | 0.522992 |
3 | 477 | 0.141795 | 0.52146 | 0.559203 |
4 | 203 | 0.060345 | 0.495633 | 0.425577 |
5 | 109 | 0.032402 | 0.503633 | 0.536946 |
6 | 52 | 0.015458 | 0.499104 | 0.477064 |
7 | 24 | 0.007134 | 0.493556 | 0.461538 |
8 | 9 | 0.002675 | 0.476896 | 0.375 |
9 | 2 | 0.000595 | 0.438102 | 0.222222 |
Length | Count | % | root | cum_root |
1 | 1464 | 0.462998 | 0.462998 | 0.462998 |
2 | 783 | 0.247628 | 0.497622 | 0.534836 |
3 | 447 | 0.141366 | 0.520933 | 0.570881 |
4 | 231 | 0.073055 | 0.519891 | 0.516779 |
5 | 103 | 0.032574 | 0.504168 | 0.445887 |
6 | 71 | 0.022454 | 0.531149 | 0.68932 |
7 | 32 | 0.01012 | 0.518832 | 0.450704 |
8 | 19 | 0.006009 | 0.527654 | 0.59375 |
9 | 7 | 0.002214 | 0.507008 | 0.368421 |
10 | 3 | 0.000949 | 0.498558 | 0.428571 |
 The first graph plots the average root, the second graph plots the cumulative root. The data becomes less reliable as the length increases as there are less such events but the general trend seems to be that after ... need to think about this + is it a percentage of the number of sequences, or the percentage of up days in each type of sequence?... think!

Log Actual counts (y) of sequences of up and down of length x from FTSE (1984 to 2010) in blue. The monte-carlo simulation seems to contain an error but is nearly correct.
In a binary sequence a "pair" means 11 following a 0 and preceeding a codon starting in 0. The probability of a 011 sequence is 1/8 and the probabilility that the next codon starts with 0 is 1/2 so 1/16. Thus the probability of sequences of length l is 2^-(l+2)
[check the length of sequences! an error]
Assuming the rare sequences have more error so ignoring the deviance of graph, this suggests that indeed the stock market is random in that ups and downs don't seem to stick together any more than at random.
 That said here is a plot of a walk based on the up/down data from the FTSE ignoring the size of the move. It very clearly shows a periodicity in the stock movements. This means the periodicity lies in the up/down data not the distance data. So it is random on the daily level but patterns show up on the macro level.
Finally the need to examine the charts with the extra factor of scale. Not sure yet how to proceed.

No comments:
Post a Comment