Showing posts with label 2Do. Show all posts
Showing posts with label 2Do. Show all posts
Friday, 21 January 2011


Monday, 3 January 2011
Smart Dog Chaser
http://www.foxnews.com/scitech/2010/12/23/worlds-smartest-dog-knows-words/
It seems, and I'll assume, that there is a cognitive ability here and the dog isn't simply mapping a sound (sentence) to an action Pavlovian style. In which case are we to think that dogs in their natural social groups have this level of communication being able to code 1000s of different individual things?
We it seems obvious that to interact in the world (putting a bone here, picking up some meat etc) a dog must have this level of complexity in their world. Being able to link this complexity with an audio world (of command sounds) seems not so extraordinary. Why should decoding the audio world be any more important that decoding the physical world? A stone marking the place where a bone is, or a coloured button, or a researcher saying "go to bone" which both give the desired outcome. I'm impressed by the dog but not so much by the remarkableness of the skills which seem essential to any creature that can live "in" the world. That world becomes a human world and the creature simply adapts to human details rather than wild details and then we suddenly applaud their cognisance which was always there. Am I missing something here? I blog this so I am reminded to think about it again...
Saturday, 11 December 2010
n digit binary rational numbers
There are 8 binary fractions with 3 digits:
{.000,.001,.010,...,0.111}
If we were to chose such a fraction at random them the probability would be 1/8 or in binary 0.001
This is a 3 digit binary fraction!
So we can say that there is a 1/8 chance of picking the 3 digit fraction which represents the probability that it was picked.
OR we can say that .001 is that binary number that represents the probability that itself gets picked.
Scenario 1) If we have a lucky dip (with replacement) with these numbers buried in the wood chips then on average every 8 tries we will pick out .001. We have only one go.
Scenario 2) If we have another bucket of these numbers and we go seeking the answer to the question above about the probability of picking .001 we don't get one go we need a few goes to get the answer. In this case we are "seeking" the answer and only one asnwer will do.
Let us assume that numbers are things with "selves". We are lying in the bucket waiting to get picked. When we are picked we say what we are. In scenario 1 we are waiting and when we eventually get picked (in one of the trials) we say that we are the probability that we were actually picked. We might think that we were special here because we are saying something about ourself.
In the second scenario however we need to answer that we are the probability that we get picked in random trials - which this isn't.
I have someone talking at length in the library which is distracting me from this quite involved thought - I could ask them to hold the discussion outside but I guess they have their reasons - oh good they stopped...
The original thought was this...
.001 is just one amongst the 8 numbers. It has a property that it will be picked 1 in 8 times in random trials, and it is true that it represents that property. ".010" has the same propertybut it just "happens" that it doesn't represent that property. There is no causal link between the number and it bearing that property. It is effectively chance that it has that property altho the chance can't be easily worked out.
Let Self-Knowing be the name of the property of having the value that represents the probability of that number in binary being picked at random from numbers of equal digits.
The SK(x) function returns true for x=0.001. Then what is the property of Not(Self-Knowing) i.e. SK(x)
The probability of not picking ".001" is 0.111 and the probability of not picking ".111" is 0.111. ".111" represents the probability that it itself is not picked. Interesting if that could be folded into the question of finding the probability in the first place so that it could be proven never to be known!
2bcompleted...
{.000,.001,.010,...,0.111}
If we were to chose such a fraction at random them the probability would be 1/8 or in binary 0.001
This is a 3 digit binary fraction!
So we can say that there is a 1/8 chance of picking the 3 digit fraction which represents the probability that it was picked.
OR we can say that .001 is that binary number that represents the probability that itself gets picked.
Scenario 1) If we have a lucky dip (with replacement) with these numbers buried in the wood chips then on average every 8 tries we will pick out .001. We have only one go.
Scenario 2) If we have another bucket of these numbers and we go seeking the answer to the question above about the probability of picking .001 we don't get one go we need a few goes to get the answer. In this case we are "seeking" the answer and only one asnwer will do.
Let us assume that numbers are things with "selves". We are lying in the bucket waiting to get picked. When we are picked we say what we are. In scenario 1 we are waiting and when we eventually get picked (in one of the trials) we say that we are the probability that we were actually picked. We might think that we were special here because we are saying something about ourself.
In the second scenario however we need to answer that we are the probability that we get picked in random trials - which this isn't.
I have someone talking at length in the library which is distracting me from this quite involved thought - I could ask them to hold the discussion outside but I guess they have their reasons - oh good they stopped...
The original thought was this...
.001 is just one amongst the 8 numbers. It has a property that it will be picked 1 in 8 times in random trials, and it is true that it represents that property. ".010" has the same propertybut it just "happens" that it doesn't represent that property. There is no causal link between the number and it bearing that property. It is effectively chance that it has that property altho the chance can't be easily worked out.
Let Self-Knowing be the name of the property of having the value that represents the probability of that number in binary being picked at random from numbers of equal digits.
The SK(x) function returns true for x=0.001. Then what is the property of Not(Self-Knowing) i.e. SK(x)
The probability of not picking ".001" is 0.111 and the probability of not picking ".111" is 0.111. ".111" represents the probability that it itself is not picked. Interesting if that could be folded into the question of finding the probability in the first place so that it could be proven never to be known!
2bcompleted...
Wednesday, 8 December 2010
Random Walk Again
NOTE: I must not forget that the primary purpose of this questioning is to create a realistic stock market model to test cellular automata (bots) on. Altho I realise I could just try them out on actual data and maybe that would be better. However it is intriguing to know the nature of the beast.

===
Using stochastic matrix method with a matrix (M) size 21x21 following this pattern and with data from the BP (NYSE) graph i.e. p(up) = 0.47, p(same) = 0.04, p(down) = 0.49
0.04 | 0.47 | 0 | 0 | 0 |
0.49 | 0.04 | 0.47 | 0 | 0 |
0 | 0.49 | 0.04 | 0.47 | 0 |
0 | 0 | 0.49 | 0.04 | 0.47 |
0 | 0 | 0 | 0.49 | 0.04 |
Then after nine moves i.e. M^9 the mid row corresponding to the probability of the system arriving at any one of the 21 states starting at the middle state is (and rotated into a column):
10 | 0.00079792 |
9 | 0.00065137 |
8 | 0.00789282 |
7 | 0.0056751 |
6 | 0.03487872 |
5 | 0.02192446 |
4 | 0.09070506 |
3 | 0.04929454 |
2 | 0.15376394 |
1 | 0.07108634 |
0 | 0.17756573 |
-1 | 0.06818486 |
-2 | 0.14146795 |
-3 | 0.04350149 |
-4 | 0.07677832 |
-5 | 0.01780073 |
-6 | 0.02716259 |
-7 | 0.00423922 |
-8 | 0.00565518 |
-9 | 0.00044765 |
-10 | 0.00052599 |
Which is like the computer model I produced by brute force. But doing this again and with a different mental state myself I see that the periodicity (last post) is a natural product of the maths. As a stock market shifts state up and down the probability of it arriving at various prices is not continuous by peaked with low probability troughs between the peaks, and the dy/dx will oscillate. So like electrons around the nucleus in classical physics it will seem to accelerate between levels and then stay relatively stable inside a probability channel. Of course this is a painfully simple model of something that has an indefinable number of influences but it maybe shows the origin of the periodicity and chartist patterns that are clearly visible in the charts.
Being able to remove this random effect from stock data might reveal other things.
Thinking some more however this is probably just a sampling feature since in this model there are only 3 options. A move up, down or no move and to get anywhere in the price space is thus severely restricted making certain positions very unlikely. In reality there is a continuum of moves so these restrictions don't exist. But if higher-order patterns do exist then they may interact with each other to create oscillations. Brain-storming but worth gathering as many ideas as possible!
This also suggests a method for working out an algebraic formula for the probabilities 2do...
Tuesday, 7 December 2010
More sophisticated stock models...
http://www.utdallas.edu/~rxc064000/Make/01578783.pdf
extraordinary that this stuff has only been done in the last decade, as if the financial incentives aren't there for the research... even more profitable than military surely.
some reading todo
Really off to town... need to get Bayesian reasoning under belt.
Monday, 6 December 2010
Stock Sequence
The number of up trends of given length in the data set, e.g. there were 1631 days when the stock only went up for one day and then down the next. On the random walk model the up probability is unaffected by the length of sequence, and vice-versa the length of sequence is not affected by any factor other than randomness. The probability of a sequence of two is the probability of a single sequence squared, and so on. The jth root was taken for each percentage where j was the length. The Cum_Root column assumes that the probability of the previous up moves is given by the rows above and so calculated the probability of adding an extra day to the sequence. This is the most important statistic as it shows, on average, the probability of the current (local) up trend from continuing. Obviously the next down may only be a single day before the trend continues. A better analysis is required for what becomes Elliot waves/Fractals etc - to come as soon as I work out how!
Data for FTSE
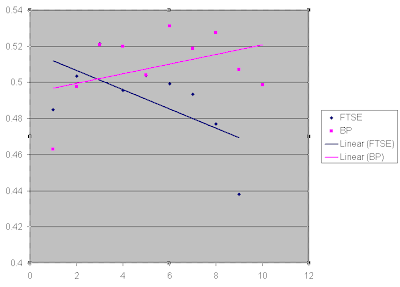 The first graph plots the average root, the second graph plots the cumulative root. The data becomes less reliable as the length increases as there are less such events but the general trend seems to be that after ... need to think about this + is it a percentage of the number of sequences, or the percentage of up days in each type of sequence?... think!


Log Actual counts (y) of sequences of up and down of length x from FTSE (1984 to 2010) in blue. The monte-carlo simulation seems to contain an error but is nearly correct.
In a binary sequence a "pair" means 11 following a 0 and preceeding a codon starting in 0. The probability of a 011 sequence is 1/8 and the probabilility that the next codon starts with 0 is 1/2 so 1/16. Thus the probability of sequences of length l is 2^-(l+2)
[check the length of sequences! an error]
Assuming the rare sequences have more error so ignoring the deviance of graph, this suggests that indeed the stock market is random in that ups and downs don't seem to stick together any more than at random.
 That said here is a plot of a walk based on the up/down data from the FTSE ignoring the size of the move. It very clearly shows a periodicity in the stock movements. This means the periodicity lies in the up/down data not the distance data. So it is random on the daily level but patterns show up on the macro level.
Finally the need to examine the charts with the extra factor of scale. Not sure yet how to proceed.
Data for FTSE
Length | Count | % | root | cum_root |
1 | 1631 | 0.484839 | 0.484839 | 0.484839 |
2 | 853 | 0.253567 | 0.503555 | 0.522992 |
3 | 477 | 0.141795 | 0.52146 | 0.559203 |
4 | 203 | 0.060345 | 0.495633 | 0.425577 |
5 | 109 | 0.032402 | 0.503633 | 0.536946 |
6 | 52 | 0.015458 | 0.499104 | 0.477064 |
7 | 24 | 0.007134 | 0.493556 | 0.461538 |
8 | 9 | 0.002675 | 0.476896 | 0.375 |
9 | 2 | 0.000595 | 0.438102 | 0.222222 |
Length | Count | % | root | cum_root |
1 | 1464 | 0.462998 | 0.462998 | 0.462998 |
2 | 783 | 0.247628 | 0.497622 | 0.534836 |
3 | 447 | 0.141366 | 0.520933 | 0.570881 |
4 | 231 | 0.073055 | 0.519891 | 0.516779 |
5 | 103 | 0.032574 | 0.504168 | 0.445887 |
6 | 71 | 0.022454 | 0.531149 | 0.68932 |
7 | 32 | 0.01012 | 0.518832 | 0.450704 |
8 | 19 | 0.006009 | 0.527654 | 0.59375 |
9 | 7 | 0.002214 | 0.507008 | 0.368421 |
10 | 3 | 0.000949 | 0.498558 | 0.428571 |
 The first graph plots the average root, the second graph plots the cumulative root. The data becomes less reliable as the length increases as there are less such events but the general trend seems to be that after ... need to think about this + is it a percentage of the number of sequences, or the percentage of up days in each type of sequence?... think!
Log Actual counts (y) of sequences of up and down of length x from FTSE (1984 to 2010) in blue. The monte-carlo simulation seems to contain an error but is nearly correct.
In a binary sequence a "pair" means 11 following a 0 and preceeding a codon starting in 0. The probability of a 011 sequence is 1/8 and the probabilility that the next codon starts with 0 is 1/2 so 1/16. Thus the probability of sequences of length l is 2^-(l+2)
[check the length of sequences! an error]
Assuming the rare sequences have more error so ignoring the deviance of graph, this suggests that indeed the stock market is random in that ups and downs don't seem to stick together any more than at random.
That said here is a plot of a walk based on the up/down data from the FTSE ignoring the size of the move. It very clearly shows a periodicity in the stock movements. This means the periodicity lies in the up/down data not the distance data. So it is random on the daily level but patterns show up on the macro level.Finally the need to examine the charts with the extra factor of scale. Not sure yet how to proceed.
Subscribe to:
Posts (Atom)
-
The classic antimony is between : (1) action that is chosen freely and (2) action that comes about through physical causation. To date no ...
-
Following from the last blog on animal/human a beautiful male Oedemera nobilis resting in a flower after presumably a good meal of po...
-
Wanted to know the pattern of UN votes over Venezuela and then got into seeing if ChatGPT could see the obvious pattern of Imperialism here....

