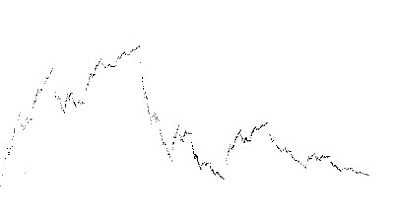
Here is the 1st attempt at implementing the IFS from that Chinese paper (which they misquoted from Barnsley)...
The paper fails to explain the importance of the "d" stretch parameters, and does not explain how they were discovered. I don't believe after searching that there is a set of "d" parameters that will recover the Shanghai stock trace as described in the paper. Is this another mistake in the paper, a failure on my behalf or deliberate fraud... don't know.
===
Rather than look at only the price some thought was given to the role of volume. The population of sellers and buyers in a market will change respectively in size and also in mean and standard deviation. This reasonably I assume does obey the normal distribution. Where the two curves over lap is where trading occurs. Large differences in mean will result in large shifts in price, with respective numbers of traders determining in whose favour the price goes, while large overlaps will result in large volumes of trades. Flattening standard deviations then are associated with large volumes, and different means correspond to price changes. Somehow deducing these parameters from the stock charts would be good insight into the markets...
===
Following the logic thought about the "stack price". The stack might be the pile of held stock. Some is for investment and will be held for a long time so is far down the stack, some is speculative and goes around quickly. Assuming that stock is traded only once a day then volume as a percentage of the total issued shares combined with the mid price of the day determines what the average holding of share holders is the next day, loosely called the volume weighted average price VWAP here.
It was thought the VWAP would give more information about the behaviour of investors than the chart price.
This is the number of days spent at each VWAP price for the BP-NYSE chart (prices are in 3dollars). There are very distinct prices to which the price returns and of interest (but not yet explored) is the fractal bifurcating peak in the middle. The whole peak is split into two in the same ratio as each prong is split into two. This is also a bifurcation tho no evidence for the Feigenbaum constant.
===

Again BP the frequency distribution of Volume and daily High-Low price on suitable X scales. Interesting how volumes and size of days range appear to obey the same law.
===

The Blue curve is the High/Low distribution the Magenta is the Poisson distribution. When have time it's another probability distribution search.
===
Conclusion still no decent attractors, or any real understanding of the stock market - 4 months coming up... should knock this on the head for a while... but give it 4 weeks more first.


No comments:
Post a Comment